8.7.2

Improvements / Fixes
- LMU: fixed the Weather Monitor overlay forecast and current weather conditions
Color blind mode for the overlays, a switch to keep the standard colors in your stream and two fixes for AMS2.
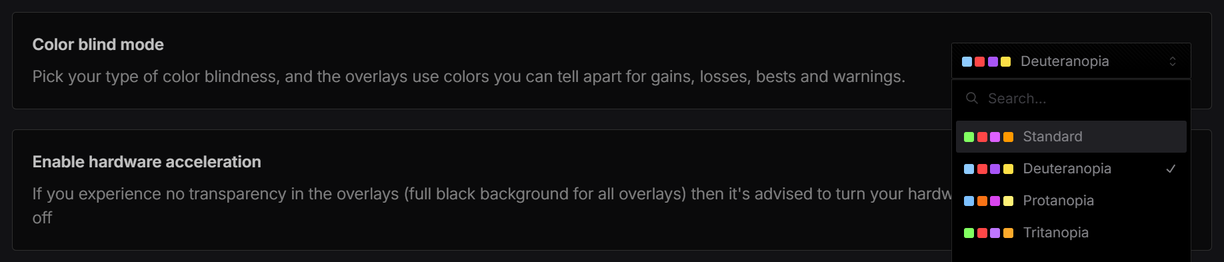
Pick your type of color blindness in Settings > General: Deuteranopia, Protanopia or Tritanopia. The four squares next to each option are its colors for faster, slower, session best and warning.
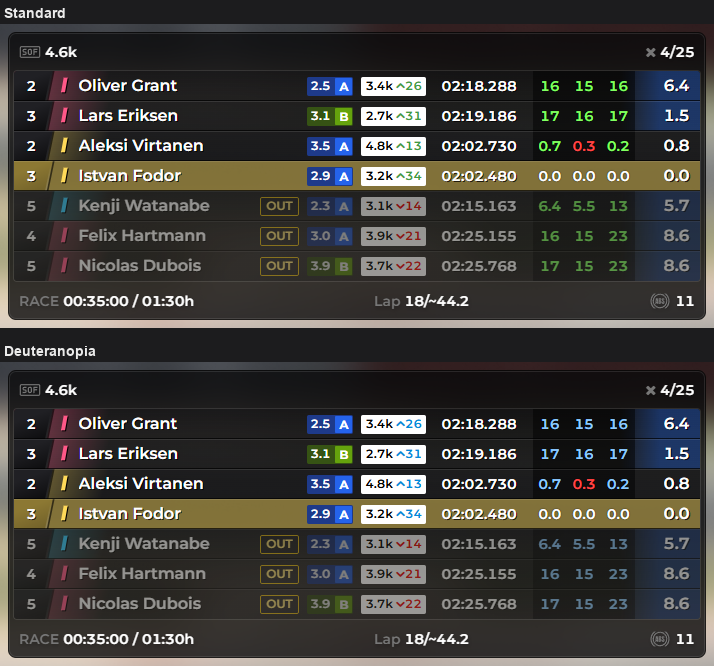
The overlays then show time gains and losses, personal and session bests, cars a lap ahead or behind and warnings in colors you can tell apart. Flags, car class colors and colors you picked yourself stay as they are.
Relative in Standard and Deuteranopia: the lap time gains and the iRating gains turn light blue, losses stay red. Protanopia also turns losses orange. Tritanopia keeps red and green and changes only the colors it can't tell apart, like the purple of the session best.
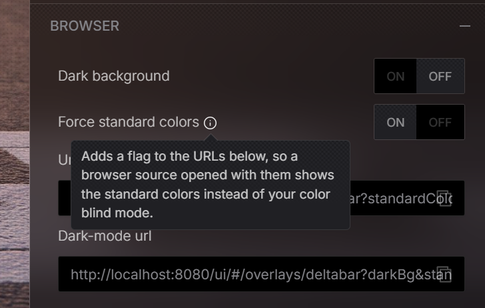
Each overlay's Browser settings, with the URLs you paste into OBS as a browser source, have a new Force standard colors switch. It shows while a color blind type is selected. Turn it on and the URLs get a flag, so the browser source shows the standard colors. Your stream viewers see the usual colors while you use color blind mode in the app.
Driver info and name settings for Head 2 Head, a driver limit for the Overtake Alert, a trace speed for Input Telemetry, more accurate car positions on the maps and a fix for Chat in VR.
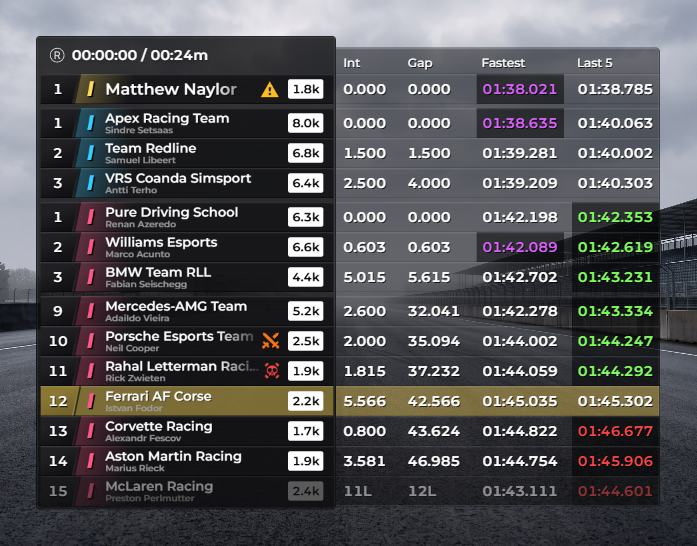
Head 2 Head can show the iRating, tire compounds and pit badges of the cars ahead and behind you: the lap and time of their last pit stop, OUT on an out lap and TOW while they are towed to their pit box (iRacing). Turn them on in the new Driver info tab and choose where they go with Placement.
Next to name: the info sits next to each driver's name.
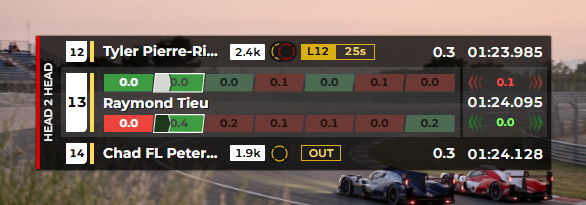
Replace sector times: the info of the car ahead and the car behind takes the place of the sector times in your row, which leaves more room for the names.
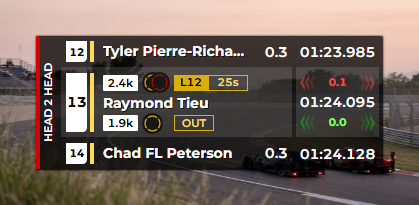
Choose how driver names are written, for example Firstname Lastname, F. Lastname or a three-letter code, and set the width of the names in pixels. At 0 the names fit the space available. Both settings are in the Driver info tab.
Set how many cars the Overtake Alert shows at once, from 1 to 10. When more cars are in range, it shows the closest ones.
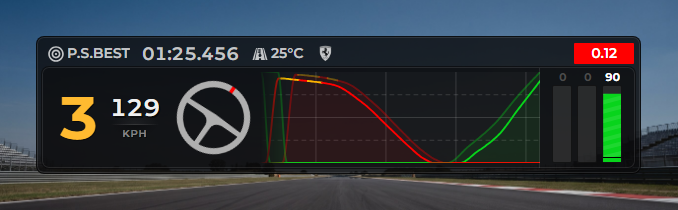
Set how fast the graph scrolls, from 20% to 300%. At 100% it moves like before. Higher values scroll faster and show fewer seconds of driving, so each braking zone gets wider. The graph keeps the same speed when you change Telemetry Length.
50%: twice the seconds in the same width.
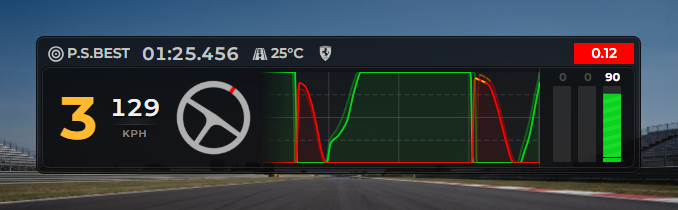
100%:
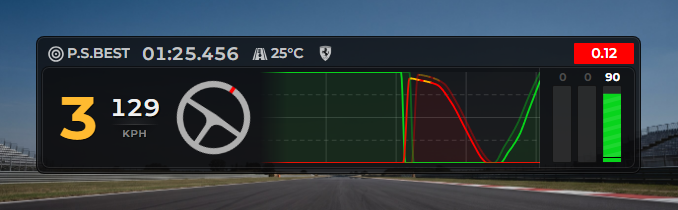
200%: half the seconds in the same width.
Three new fuel overlays, a fuel target per lap, a tow countdown for iRacing, color limits for engine temperatures and more control over gap decimals.
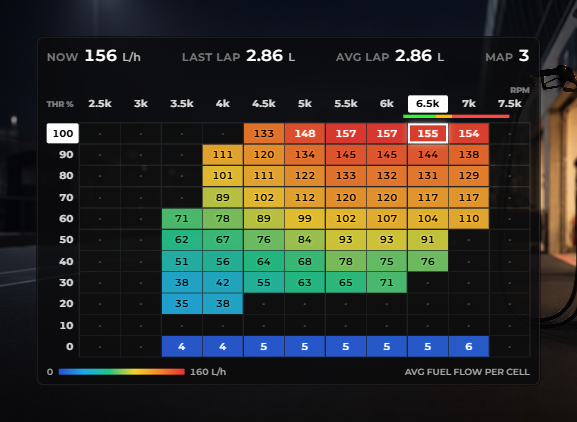
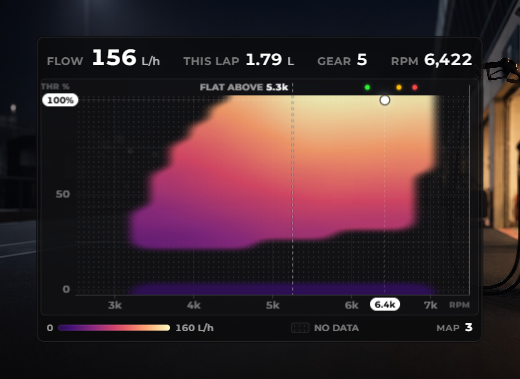
Your average fuel flow for every RPM and throttle position, filled in while you drive. Show it as a table or as a heat field.
Table: the average flow in each cell, colored from low to high.
Heat field: the same data as a smooth color map, with your current position marked.
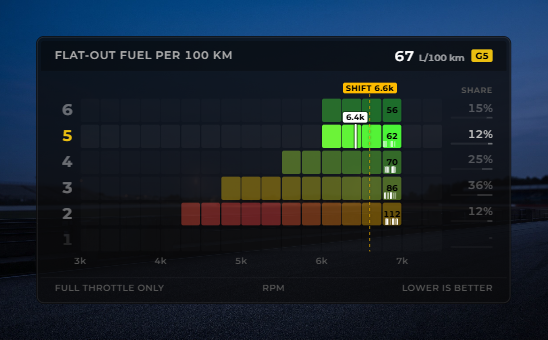
How much fuel each gear uses at full throttle across the RPM range, with your shift point marked. Lower is better.
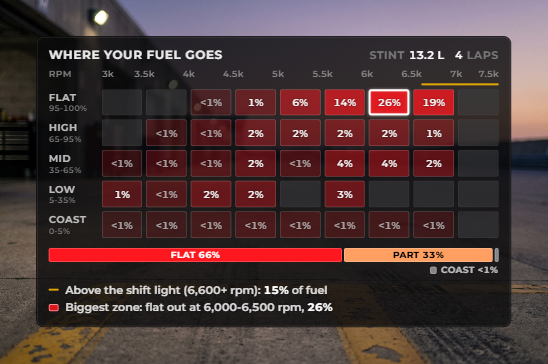
Where your fuel goes: the share used in each RPM and throttle zone, from coasting to flat out.
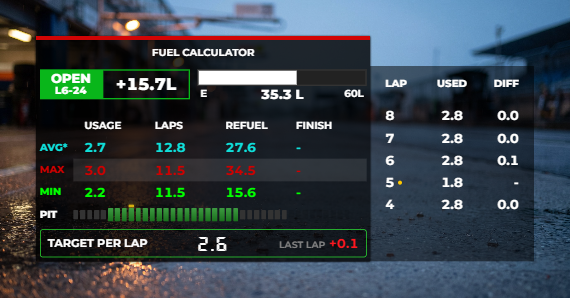
The fuel per lap that gets you to the finish. Next to it you see how far your last lap was over (red) or under (green) that target. Turn it on in the Fuel Calculator settings.
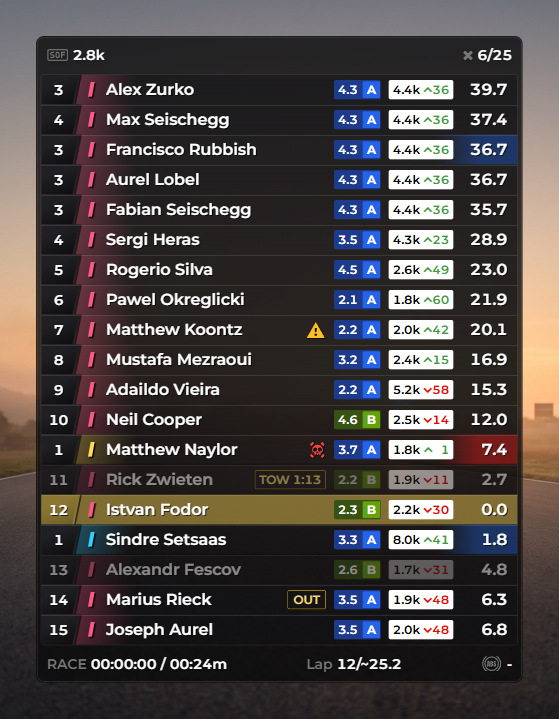
The Relative and Standings overlays show a TOW badge on cars that are being towed to their pit box, with the time left until they can leave it. For other cars the time is an estimate. Turn it on in the Pit info settings.
Set the temperatures at which the value turns green, orange or red. Each color can be turned on or off on its own.

Choose how many decimals (0 to 3) the gap and interval show in the Standings and Horizontal Standings overlays.
Choose which screen Racelab opens on in Settings > General.
The overlay list is now grouped by topic, so related overlays sit together.